Creates three diagnostic plots for a JDSimResult object: a simulated path fan chart, a histogram of log-returns with a normal density overlay, and the autocorrelation function of squared log-returns.
Arguments
- object
A JDSimResult object.
Value
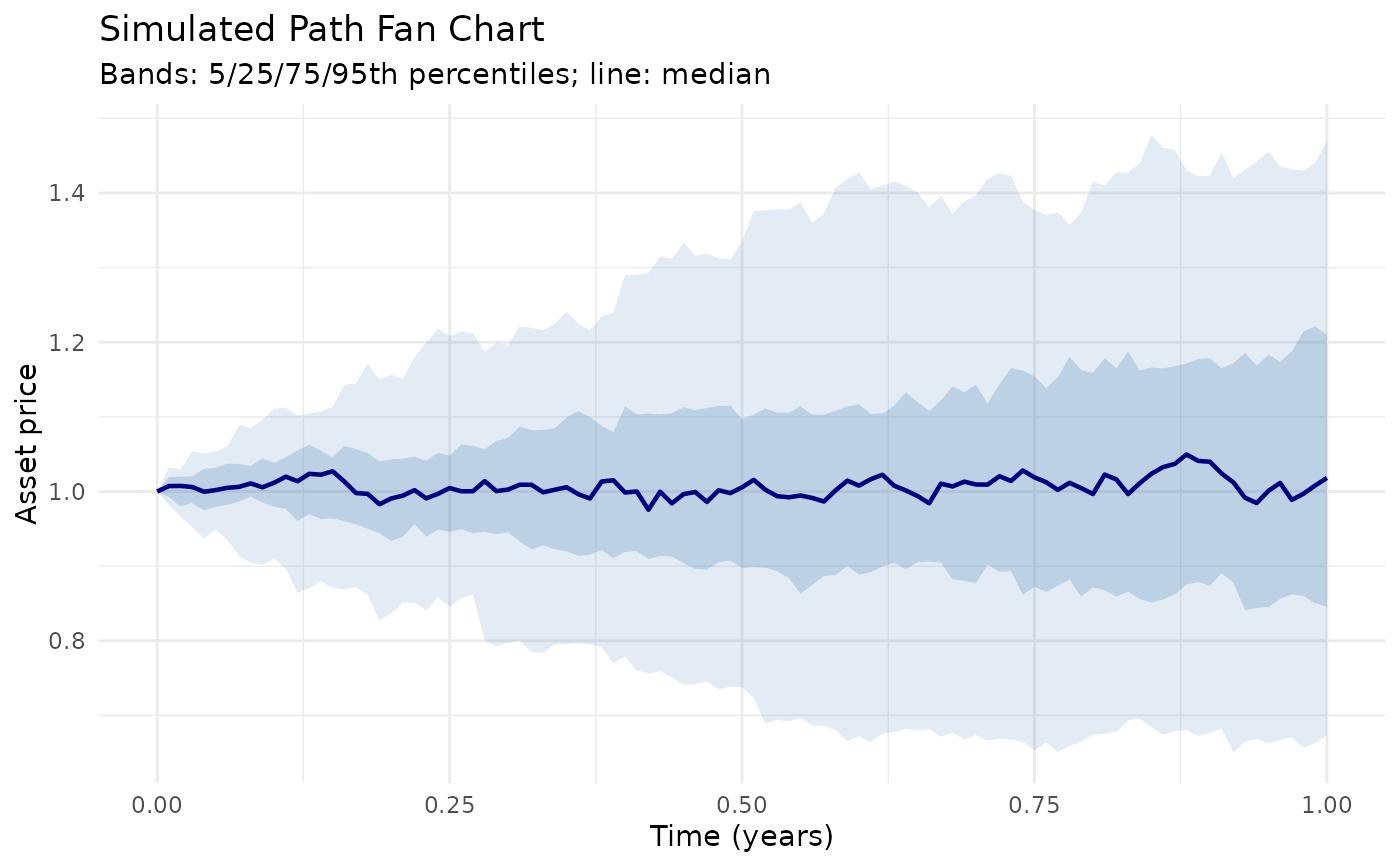
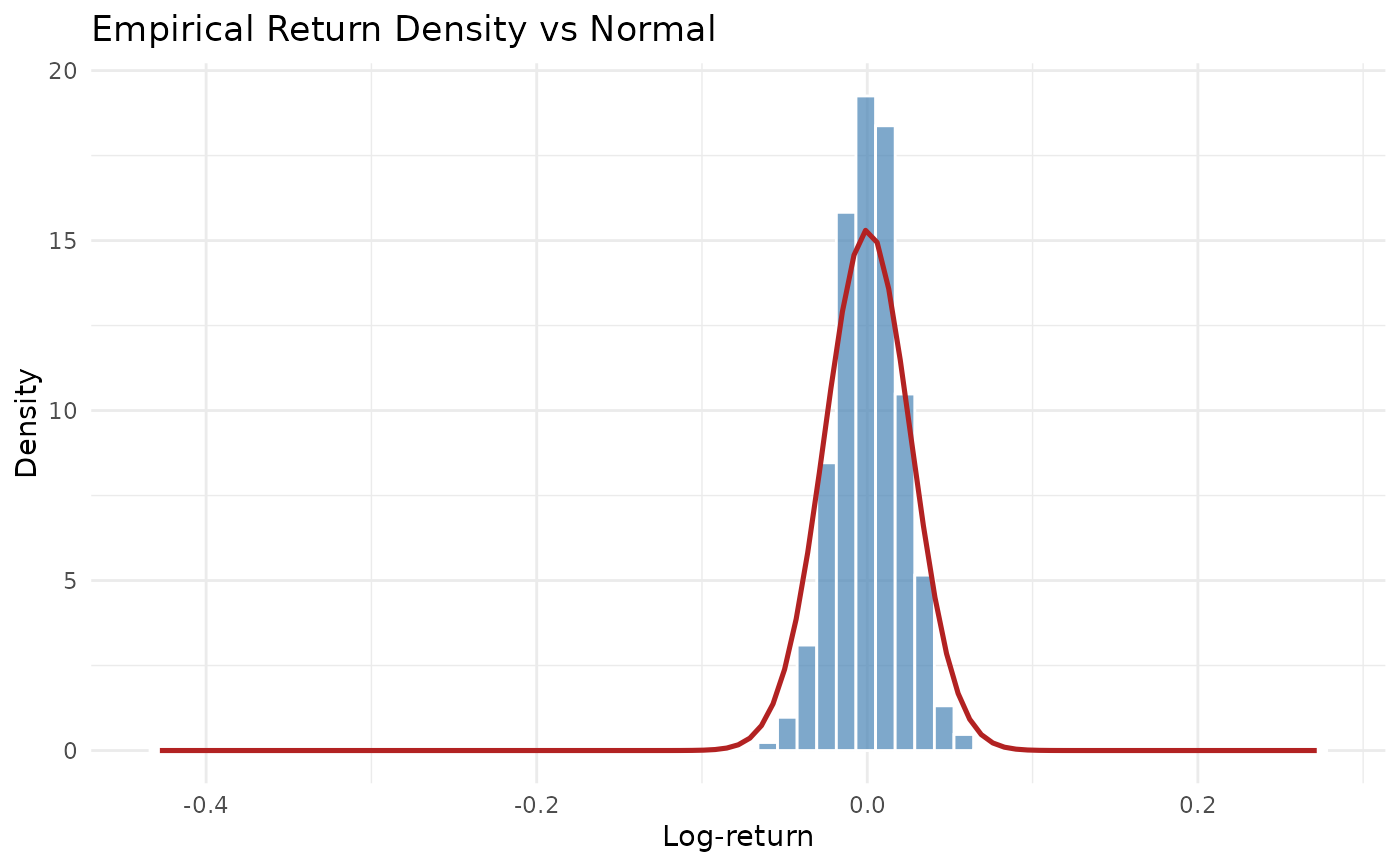
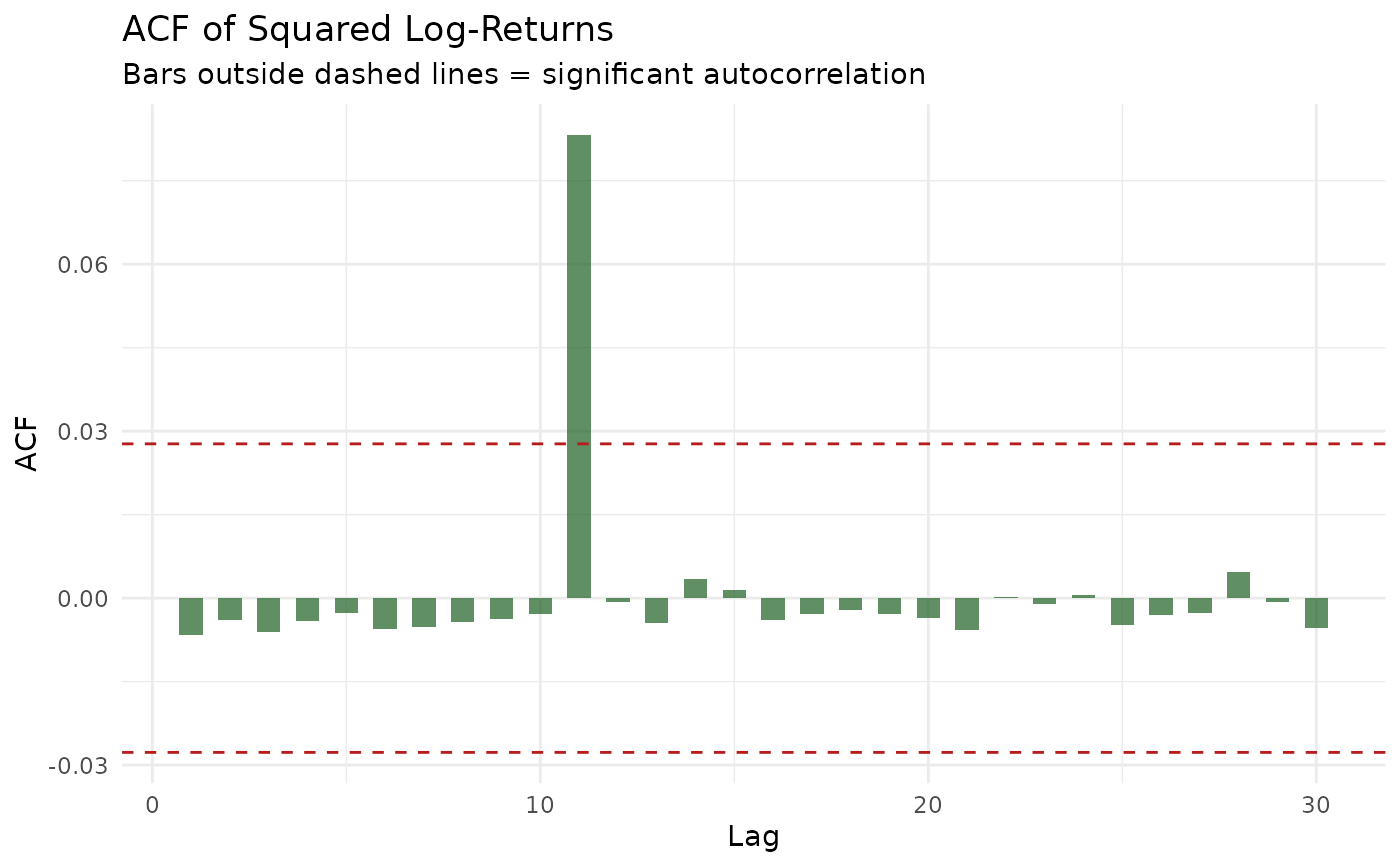
A named list of three ggplot objects:
fan_chart: simulated path quantile fan chart.density: histogram of log-returns with a normal overlay.acf_sq: autocorrelation of squared log-returns with 95\
Examples
# \donttest{
m    <- MertonModel()
sim  <- simulateMerton(m, n = 50, T_ = 1, steps = 100)
plts <- diagnosticPlots(sim)
print(plts$fan_chart)

print(plts$density)

print(plts$acf_sq)

# }
# }